Navigating the dynamic terrain of Human Resources (HR) demands astute decision-making. For HR professionals seeking empowerment, the arsenal of statistical tools, including the formidable duo of regression and correlation analysis, proves to be a game-changer. This article takes an immersive dive into the intricacies of these analyses using Minitab, SPSS, and Excel, illuminating the subtleties of interpretation and unveiling their distinct applications. Join us on a journey to unravel the power within the data-driven landscapes of HR decision-making.
Understanding Regression Analysis:
What is Regression Analysis?
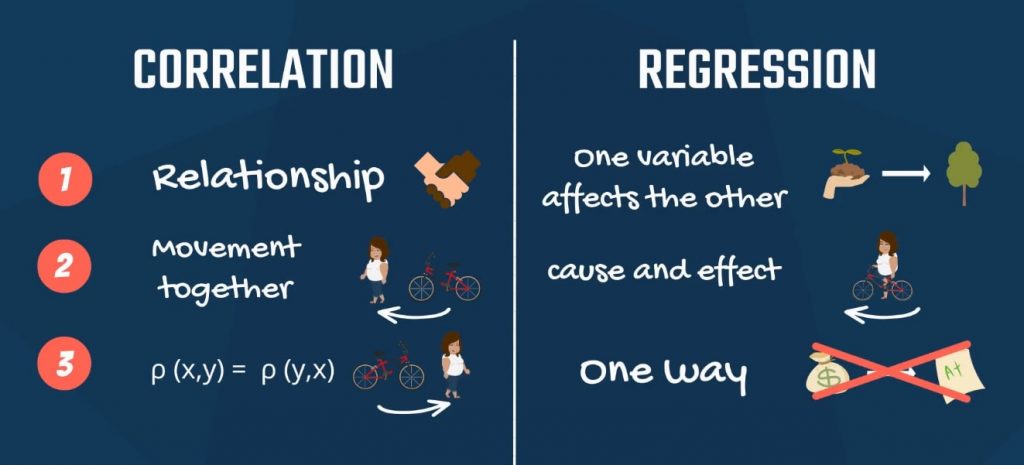
Regression analysis is a statistical method that investigates the relationship between a dependent variable and one or more independent variables. In the HR context, this can be employed to understand how certain factors influence outcomes such as employee performance, job satisfaction, or retention.
Why Regression Analysis in HR?
Insights into Causation:
- Regression analysis allows HR professionals to explore causal relationships between variables. For instance, understanding how training hours correlate with employee productivity.
Predictive Modeling:
- It enables the creation of predictive models, forecasting outcomes based on identified patterns. This is crucial in workforce planning and resource allocation.
Identifying Significant Factors:
- By examining coefficients and p-values, HR can identify which factors significantly impact the dependent variable, aiding in targeted interventions.
Types of Regression Analysis:
- Simple Linear Regression:
- Involves one independent variable and one dependent variable. Ideal for exploring the linear relationship between two variables.
- Multiple Regression:
- Incorporates multiple independent variables to analyze their collective impact on the dependent variable. Useful for HR scenarios with multifaceted influences.
- Logistic Regression:
- Applied when the dependent variable is binary (e.g., turnover – yes or no). Useful in predicting outcomes with two possible categories.
Regression Analysis Interpretation:
Coefficients:
- Positive Coefficient: A positive coefficient suggests a positive relationship; an increase in the independent variable leads to an increase in the dependent variable.
- Negative Coefficient: A negative coefficient signifies a negative relationship; an increase in the independent variable corresponds to a decrease in the dependent variable.
P-values:
- Significance Level (α): Typically set at 0.05. A p-value less than α indicates that the relationship between the variable and the outcome is statistically significant.
R-squared:
- Explained Variance: R-squared measures the proportion of variance in the dependent variable explained by the independent variables. A higher R-squared indicates a better-fitting model.
Understanding Correlation Analysis:
What is Correlation Analysis?
Correlation analysis assesses the strength and direction of the linear relationship between two continuous variables. In HR, this can be applied to understand how variables like employee engagement and job satisfaction relate.
Why Correlation Analysis in HR?
Identifying Associations:
- Correlation analysis helps in identifying associations between variables, offering insights into potential factors influencing each other.
Data Screening:
- Before conducting regression analysis, HR professionals often use correlation analysis to identify relationships that warrant further exploration.
Types of Correlation Analysis:
- Pearson Correlation:
- Measures linear association between two continuous variables. Suitable for variables with a linear relationship.
- Spearman Rank Correlation:
- Assesses the monotonic relationship between variables. Useful when dealing with ordinal or non-normally distributed data.
- Point-Biserial Correlation:
- Examines the relationship between a binary variable and a continuous variable.
Correlation Analysis Interpretation:
Correlation Coefficients:
- Strength of Relationship:
- A correlation coefficient close to +1 indicates a strong positive relationship, while close to -1 implies a strong negative relationship.
- Direction of Relationship:
- Positive coefficients signify a positive association, whereas negative coefficients indicate a negative association.
- Magnitude:
- The magnitude of the correlation coefficient reflects the strength of the association. Values closer to 0 suggest a weaker relationship.
Choosing Between Regression and Correlation Analysis:
When to Use Regression:
- Use regression when exploring causal relationships and predicting outcomes.
- Employ regression when dealing with one or more independent variables influencing a dependent variable.
- Regression is apt for scenarios requiring a predictive modeling approach.
When to Use Correlation:
- Use correlation when investigating the strength and direction of relationships between two continuous variables.
- Correlation is valuable for initial exploratory analysis to identify potential associations.
- Correlation is appropriate when causation is not the primary focus, and the aim is to understand patterns.
Applying Regression and Correlation Analysis in Different HR Scenarios:
Employee Performance Evaluation:
Minitab:
- Data Input:
- Enter employee performance metrics and potential influencing factors into Minitab.
- Ensure the dependent variable (performance) and independent variables (e.g., training hours, satisfaction) are identified.
- Conducting Regression Analysis:
- Navigate to “Stat” > “Regression” > “Regression.”
- Specify performance as the dependent variable and relevant factors as independent variables.
- Examine coefficients and p-values to identify significant contributors to performance.
- Conducting Correlation Analysis:
- Navigate to “Stat” > “Basic Statistics” > “Correlation.”
- Select performance and potential influencing factors.
- Interpret correlation coefficients to understand the strength and direction of relationships.
SPSS:
- Data Input:
- Import performance and influencing factors data into SPSS.
- Conducting Regression Analysis:
- Go to “Analyse” > “Regression” > “Linear.”
- Specify the dependent variable (performance) and independent variables.
- Analyze coefficients and significance levels.
- Conducting Correlation Analysis:
- Go to “Analyse” > “Correlate” > “Bivariate.”
- Select performance and influencing factors.
- Interpret correlation coefficients.
Excel:
- Data Input:
- Organize performance and influencing factors data in Excel.
- Conducting Regression Analysis:
- Utilize the “Data Analysis” tool.
- Select “Regression” and input the relevant data range.
- Examine coefficients and R-squared values.
- Conducting Correlation Analysis:
- Use the “Data Analysis” tool.
- Select “Correlation” and input the data range.
- Interpret correlation coefficients.
Employee Satisfaction and Turnover:
Minitab:
- Data Input:
- Input data on employee satisfaction, turnover, and potential influencing factors into Minitab.
- Conducting Regression Analysis:
- Navigate to “Stat” > “Regression” > “Regression.”
- Specify turnover as the dependent variable and relevant factors as independent variables.
- Analyze coefficients and p-values.
- Conducting Correlation Analysis:
- Navigate to “Stat” > “Basic Statistics” > “Correlation.”
- Select turnover and potential influencing factors.
- Interpret correlation coefficients.
SPSS:
- Data Input:
- Import satisfaction, turnover, and influencing factors data into SPSS.
- Conducting Regression Analysis:
- Go to “Analyse” > “Regression” > “Linear.”
- Specify turnover as the dependent variable and relevant factors as independent variables.
- Analyze coefficients and significance levels.
- Conducting Correlation Analysis:
- Go to “Analyse” > “Correlate” > “Bivariate.”
- Select turnover and influencing factors.
- Interpret correlation coefficients.
Excel:
- Data Input:
- Organize satisfaction, turnover, and influencing factors data in Excel.
- Conducting Regression Analysis:
- Utilize the “Data Analysis” tool.
- Select “Regression” and input the relevant data range.
- Examine coefficients and R-squared values.
- Conducting Correlation Analysis:
- Use the “Data Analysis” tool.
- Select “Correlation” and input the data range.
- Interpret correlation coefficients.
Conclusion:
In the realm of HR, embracing regression and correlation analyses equips professionals with potent tools to decipher complex relationships within their workforce. The ability to interpret coefficients, p-values, and correlation coefficients empowers HR leaders to make data-driven decisions, optimize strategies, and ultimately foster a more productive and satisfied workforce. By navigating Minitab, SPSS, or Excel with a nuanced understanding of these analyses, HR professionals can unlock the full potential of their data and drive organizational success.