In the ever-evolving landscape of Human Resources (HR), where data-driven decision-making is the key to organizational success, choosing the right analytical tools is paramount. Two stalwarts, Minitab and Excel, offer distinct advantages in the realm of data analysis. This comprehensive blog post will immerse us in various HR scenarios, exploring when Minitab’s statistical precision shines and when Excel’s versatility steals the spotlight.
1. Minitab: Precision in Statistical Analysis
Description:
Minitab stands as a powerhouse in statistical analysis, empowering organizations to unearth meaningful insights from complex datasets. Its advanced statistical tools and intuitive interface make it a go-to choice for scenarios demanding precision and depth in analysis.
Key Features:
- Advanced Statistical Tools: Minitab boasts a robust set of statistical tools, including regression analysis, ANOVA, and hypothesis testing.
- Built-in Templates: The platform simplifies complex analyses with pre-built templates, ensuring accurate application of statistical methods.
- Graphical Output: Minitab excels in creating visually compelling charts and graphs, offering a nuanced view of trends.
Scenarios:
1. Employee Performance Evaluation:
Imagine conducting a comprehensive analysis of employee performance metrics – productivity, error rates, and customer satisfaction scores. Minitab steps up with precision.
- Advantages:
- Advanced Statistical Tools: Regression analysis in Minitab unveils correlations between various performance metrics.
- Built-in Templates: Simplify complex analyses with Minitab’s pre-built templates.
- Graphical Output: Create visually compelling charts to identify performance trends.
2. Training Program Assessment:
Evaluate the effectiveness of training programs with a statistical lens. Minitab’s ANOVA and control charts come into play.
- Advantages:
- ANOVA for Group Comparisons: Compare the effectiveness of different training methods.
- Control Charts for Continuous Monitoring: Continuously monitor post-training performance metrics.
- Correlation Analysis: Identify relationships between training duration, methods, and performance metrics.
2. Excel: Versatility and Accessibility
Description:
Excel, a ubiquitous tool in office environments, offers unparalleled versatility and accessibility. Its user-friendly interface makes it a staple for diverse analytical tasks, particularly in scenarios where ease of use is paramount.
Key Features:
- User-Friendly Interface: Excel’s familiar interface ensures users can manipulate and analyze data efficiently.
- PivotTables for Aggregation: PivotTables allow for dynamic analysis, breaking down data by various categories.
- Easy Data Cleaning: Excel’s data cleaning and sorting functionalities are user-friendly.
Scenarios:
1. Diversity and Inclusion Metrics:
Navigating diversity and inclusion data requires versatility and ease of use. Excel’s interface proves invaluable.
- Advantages:
- User-Friendly Interface: Excel’s familiarity ensures accessibility for users with varying levels of statistical expertise.
- PivotTables for Dynamic Insights: Dynamically analyze diversity data, breaking it down by source, department, or role.
- Conditional Formatting for Visual Alerts: Visually highlight critical milestones or potential bottlenecks in diversity initiatives.
2. Recruitment Pipeline Analysis:
Efficient recruitment is vital. Excel’s versatility shines in streamlining and analyzing the recruitment pipeline.
- Advantages:
- Data Validation for Accuracy: Ensure entered recruitment data adheres to predefined criteria.
- PivotTables for Dynamic Insights: Dynamically analyze recruitment data, breaking it down by source, department, or role.
- Conditional Formatting for Visual Alerts: Visually highlight critical milestones or potential bottlenecks in the recruitment pipeline.
Choosing the Right Tool for Diverse HR Challenges
Scenario: Employee Satisfaction Survey Analysis
Conducting thorough analyses of employee satisfaction surveys demands a tool that can distill insights effectively. Let’s explore how both Minitab and Excel fare in this scenario.
Minitab Advantages:
- Regression Analysis for Multifactorial Insights: Explore the impact of multiple factors (work-life balance, compensation, and leadership) on overall employee satisfaction.
- ANOVA for Departmental Comparisons: Conduct ANOVA to compare satisfaction levels across different departments.
Excel Advantages:
- Graphical Representation with Excel Charts: Excel’s charting capabilities shine when visualizing overall employee satisfaction trends over time.
- Survey Data Cleanup with Excel Functions: Excel’s data cleanup functionalities simplify the process of preparing survey data for analysis.
Conclusion:
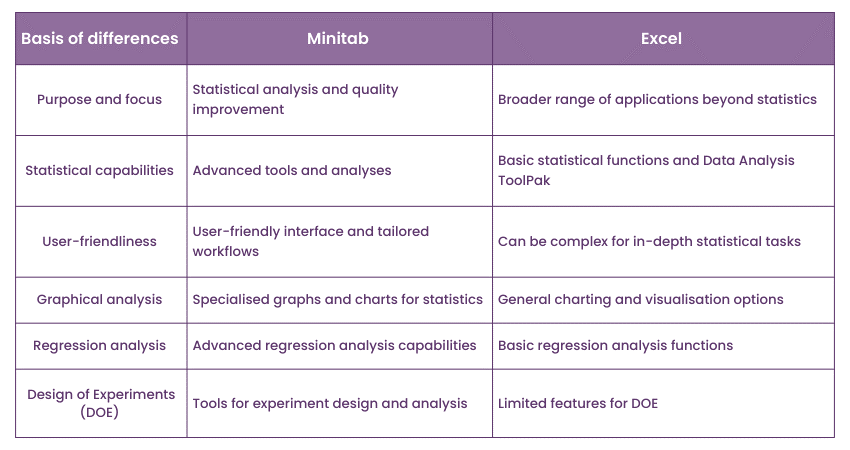
In the dynamic landscape of HR analytics, both Minitab and Excel emerge as indispensable tools, each showcasing its strengths in specific scenarios. Minitab’s statistical precision makes it ideal for in-depth analyses, while Excel’s user-friendly interface proves invaluable for tasks requiring versatility and ease of use.
The key to successful HR analytics lies in understanding the intricacies of each tool and strategically choosing the one that aligns with the nature and depth of the analysis at hand. By harnessing the combined power of Minitab and Excel, HR professionals can navigate diverse challenges, derive meaningful insights, and contribute to fostering a workplace where both employees and organizations thrive. Whether it’s untangling the complexities of employee performance, evaluating training program effectiveness, optimizing recruitment processes, or delving into the nuances of diversity and inclusion, Minitab and Excel stand as indispensable allies in the journey towards data-driven HR excellence.