In the ever-evolving landscape of Human Resources (HR), where data-driven insights steer strategic decisions, the role of analytics tools has become paramount. While Microsoft Excel has been a longstanding ally, a new generation of specialized tools is emerging, promising faster, more insightful solutions for HR professionals. In this blog post, we’ll explore how platforms like Tableau, Power BI, Google Data Studio, Domo, and Sisense are transforming HR analytics scenarios, offering a fresh perspective on data management and decision-making.
1. Tableau: Visual Storytelling for Workforce Analytics
Description:
Tableau is a leading data visualization tool known for its ability to create interactive and dynamic dashboards. Its intuitive interface allows users to connect to various data sources and create visually stunning charts and graphs.
Use Cases:
- Sales Performance Analytics:
- Visualizing regional sales data with interactive maps and filters.
- Analyzing customer behavior trends through dynamic dashboards.
HR Scenario: Real-Time Workforce Insights
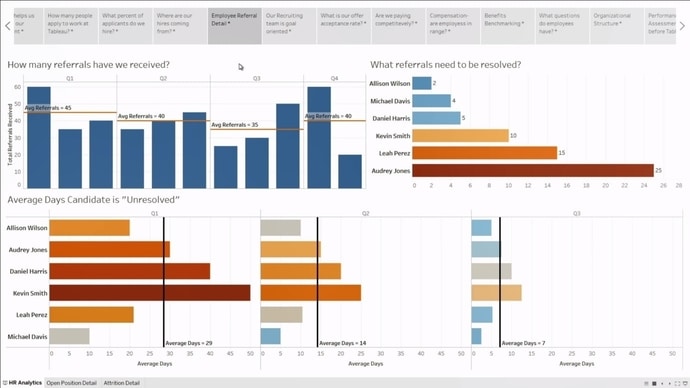
Use Case: Imagine having the ability to visually dissect workforce metrics in real-time through an interactive and dynamic dashboard. Tableau empowers HR professionals to do just that, enabling the analysis of turnover rates, diversity metrics, and performance trends using intuitive charts.
Advantages:
- Interactive Dashboards: Create dynamic, real-time dashboards that provide an instant overview of workforce dynamics.
- Seamless Data Integration: Connect Tableau to various data sources, ensuring that HR professionals are equipped with the latest and most relevant information.
- Advanced Visualization Techniques: Utilize advanced visualization techniques to uncover nuanced insights within HR metrics.
2. Power BI: Unifying HR Data for Comprehensive Insights
Description:
Power BI, a Microsoft product, is a business analytics tool that enables users to visualize data and share insights across an organization. It integrates seamlessly with other Microsoft tools, offering a comprehensive suite for data analysis.
Use Cases:
- Financial Reporting:
- Creating comprehensive financial reports with interactive visuals.
- Analyzing budget vs. actual performance using real-time data.
HR Scenario: Integrated HR Analytics
Use Case: Power BI offers HR professionals the capability to integrate data from multiple sources, including payroll, performance evaluations, and recruitment processes, providing a unified analytics platform. This approach enables the generation of comprehensive reports on key HR metrics and trends.
Advantages:
- Data Integration Mastery: Seamlessly integrate data from various Microsoft and third-party services, creating a unified hub for HR analytics.
- Advanced Analytics Capabilities: Leverage Power BI’s predictive modeling and forecasting tools for a deeper understanding of workforce trends.
- Collaborative Reporting: Share interactive reports and dashboards with stakeholders for collaborative decision-making.
3. Google Data Studio: Collaborative and Dynamic Reporting
Description:
Google Data Studio is a free tool that allows users to create interactive and shareable dashboards. It integrates with various Google services and third-party data connectors.
Use Cases:
- Marketing Campaign Analysis:
- Visualizing the performance of digital marketing campaigns.
- Collaboratively analyzing website traffic and user engagement
HR Scenario: Recruitment Funnel Analysis
Use Case: Google Data Studio emerges as a collaborative powerhouse, allowing HR professionals to collaboratively analyze the recruitment process through visually engaging and shareable reports. From applicant sourcing to final selection, the entire recruitment funnel can be tracked and analyzed.
Advantages:
- Real-Time Collaboration: Google Data Studio enables multiple users to collaborate in real-time, fostering teamwork among HR professionals.
- Dynamic Reports: Create visually stunning and interactive reports that can be easily shared with stakeholders, both within and outside the organization.
- Integration with Google Services: Seamlessly integrate with Google Sheets and Google Analytics for a comprehensive data approach.
4. Domo: Cloud-Based Intelligence for HR Excellence
Description: Domo is a cloud-based business intelligence (BI) platform that empowers organizations to transform raw data into actionable insights. One of its standout features is its robust charting capabilities, offering dynamic visualizations that bring data to life. Domo’s intuitive interface allows users to create, customize, and interact with charts, enabling informed decision-making across various business functions.
Key Features:
- Cloud-Based Accessibility: Domo’s cloud-based nature ensures that users can access and interact with charts from anywhere, promoting collaboration and real-time decision-making.
- Data Integration: Domo seamlessly integrates with a wide array of data sources, consolidating information for comprehensive charting.
- Predictive Analytics: Beyond static charts, Domo incorporates predictive analytics to forecast trends, facilitating proactive decision-making.
Use Cases:
- Sales Performance Dashboard:
- Chart Types: Line charts for sales trends, bar charts for regional comparisons, and doughnut charts for product-wise sales distribution.
- Insights: Track sales performance over time, identify top-performing regions, and analyze the contribution of each product to overall sales.
- Marketing Campaign Analysis:
- Chart Types: Funnel charts for campaign progression, heatmaps for audience engagement, and radar charts for multi-dimensional campaign assessment.
- Insights: Visualize the entire marketing campaign lifecycle, analyze audience interaction patterns, and assess campaign effectiveness across various metrics.
- Financial Health Overview:
- Chart Types: Bubble charts for financial risk analysis, area charts for revenue trends, and gauge charts for key performance indicators.
- Insights: Gain a holistic view of financial health, identify areas of risk through bubble charts, and monitor revenue growth over time.
HR Scenario: Employee Engagement Monitoring
Use Case: Domo’s cloud-based platform offers HR professionals the ability to monitor employee engagement comprehensively. By consolidating data from various HR and survey tools, HR teams can gain actionable insights to improve overall employee satisfaction.
Advantages:
- Cloud-Based Accessibility: Domo provides anytime, anywhere access to HR professionals, ensuring they can stay connected to workforce insights.
- Data Integration Prowess: Consolidate data from diverse sources, from HR systems to survey tools, for a comprehensive view of employee engagement.
- Predictive Analytics Features: Leverage Domo’s predictive analytics capabilities to forecast future trends in employee engagement.
5. Sisense: Comprehensive Skills Inventory Management
Description: Sisense is a comprehensive business intelligence solution designed to simplify complex data analytics. It excels in transforming disparate data sources into cohesive visualizations, and its charting capabilities play a pivotal role in this process. Sisense charts offer a balance of simplicity and depth, allowing users to glean insights from diverse datasets without the need for extensive technical expertise.
Key Features:
- Data Integration Prowess: Sisense seamlessly connects to various data sources, enabling users to create charts that draw from multiple datasets for a comprehensive view.
- Embedded Analytics: Sisense allows for the seamless integration of charts into other applications, providing a consistent user experience within existing workflows.
- Scalability: Suited for organizations of varying sizes, Sisense scales effortlessly to handle large and complex datasets.
Use Cases:
- Skills Inventory Radar Chart:
- Chart Type: Radar chart for visualizing employee skills across different competency areas.
- Insights: Easily identify employees’ strengths and weaknesses in various skill categories, aiding in skill development planning.
- Employee Engagement Heatmap:
- Chart Type: Heatmap for visually representing employee engagement scores.
- Insights: Quickly identify trends and patterns in employee engagement, facilitating targeted interventions to enhance workplace satisfaction.
- Operational Efficiency Gantt Chart:
- Chart Type: Gantt chart for visualizing project timelines and resource allocation.
- Insights: Monitor project progress, identify bottlenecks, and optimize resource allocation for improved operational efficiency.
HR Scenario: Skills Inventory Mastery
Use Case: Sisense facilitates the management and analysis of a comprehensive skills inventory by seamlessly integrating with various data sources. HR professionals can identify skill gaps and plan targeted training programs for skill development.
Advantages:
- Extensive Data Integration: Connect Sisense to a wide array of data sources, allowing HR professionals to access and analyze data from HR systems, learning management systems, and more.
- Embedded Analytics: Embed analytics directly into HR applications for a seamless user experience.
- Scalability: Sisense is scalable, making it suitable for organizations of varying sizes and data complexities.
Conclusion: Redefining HR Analytics Excellence
As HR continues its transformation into a data-driven discipline, specialized tools are becoming integral to the analytics toolkit. While Excel remains fundamental, platforms like Tableau, Power BI, Google Data Studio, Domo, and Sisense offer a new dimension to HR analytics. These tools not only provide advantages in terms of real-time visualization, collaboration features, and cloud-based accessibility but also introduce advanced analytics capabilities that go beyond the capabilities of traditional spreadsheets.
In scenarios where HR professionals need to analyze large datasets, create interactive dashboards, or collaborate seamlessly with cross-functional teams, these tools prove to be more efficient and offer deeper insights. As the landscape of HR analytics evolves, embracing these specialized tools can enhance the effectiveness and efficiency of workforce analytics, ultimately contributing to informed decision-making and strategic HR management. The journey towards HR analytics excellence is now adorned with tools that not only keep pace with data complexities but also redefine the standards of insightful decision-making in the digital era.


